A crystal ball in sunlight
62.7 GB
16.0 GB · −74%
NeurIPS 2026
1 University of California, Santa Barbara2 University of Minnesota
† Equal contribution · Correspondence: boxunxu@ucsb.edu
VAR-Q quantizes the key/value cache of visual autoregressive models to 2–8 bits with no calibration data and no retraining. It assigns one scale factor per feature channel and per generation block (a scale or a frame), following the measured magnitude structure of the cache. Across five model families and nine checkpoints, 4-bit KV caches reduce cache memory by 72–75% at generation quality close to BF16; Infinity-8B keeps its composition at INT2.
Same prompt and seed in every pair; only the KV cache is quantized. Each pair plays in sync when scrolled into view.
LongLive extends the next-frame setting to 30-second sequences; compare motion and scene consistency over the full clip.
Same model, prompt and seed within each pair; only the KV cache is quantized. KV memory is the paper's measurement at the evaluation batch size (3 clips for InfinityStar 720p, 12 for Self-Forcing, 20 for LongLive).
Infinity-8B INT2 image comparisons ↗Visual autoregression is next-block prediction. A block is the set of visual tokens emitted at one decoding step: a resolution scale in next-scale models (VAR, Infinity, InfinityStar), a frame in next-frame models (Self-Forcing, LongLive). Every block attends to the KV cache of all blocks before it.
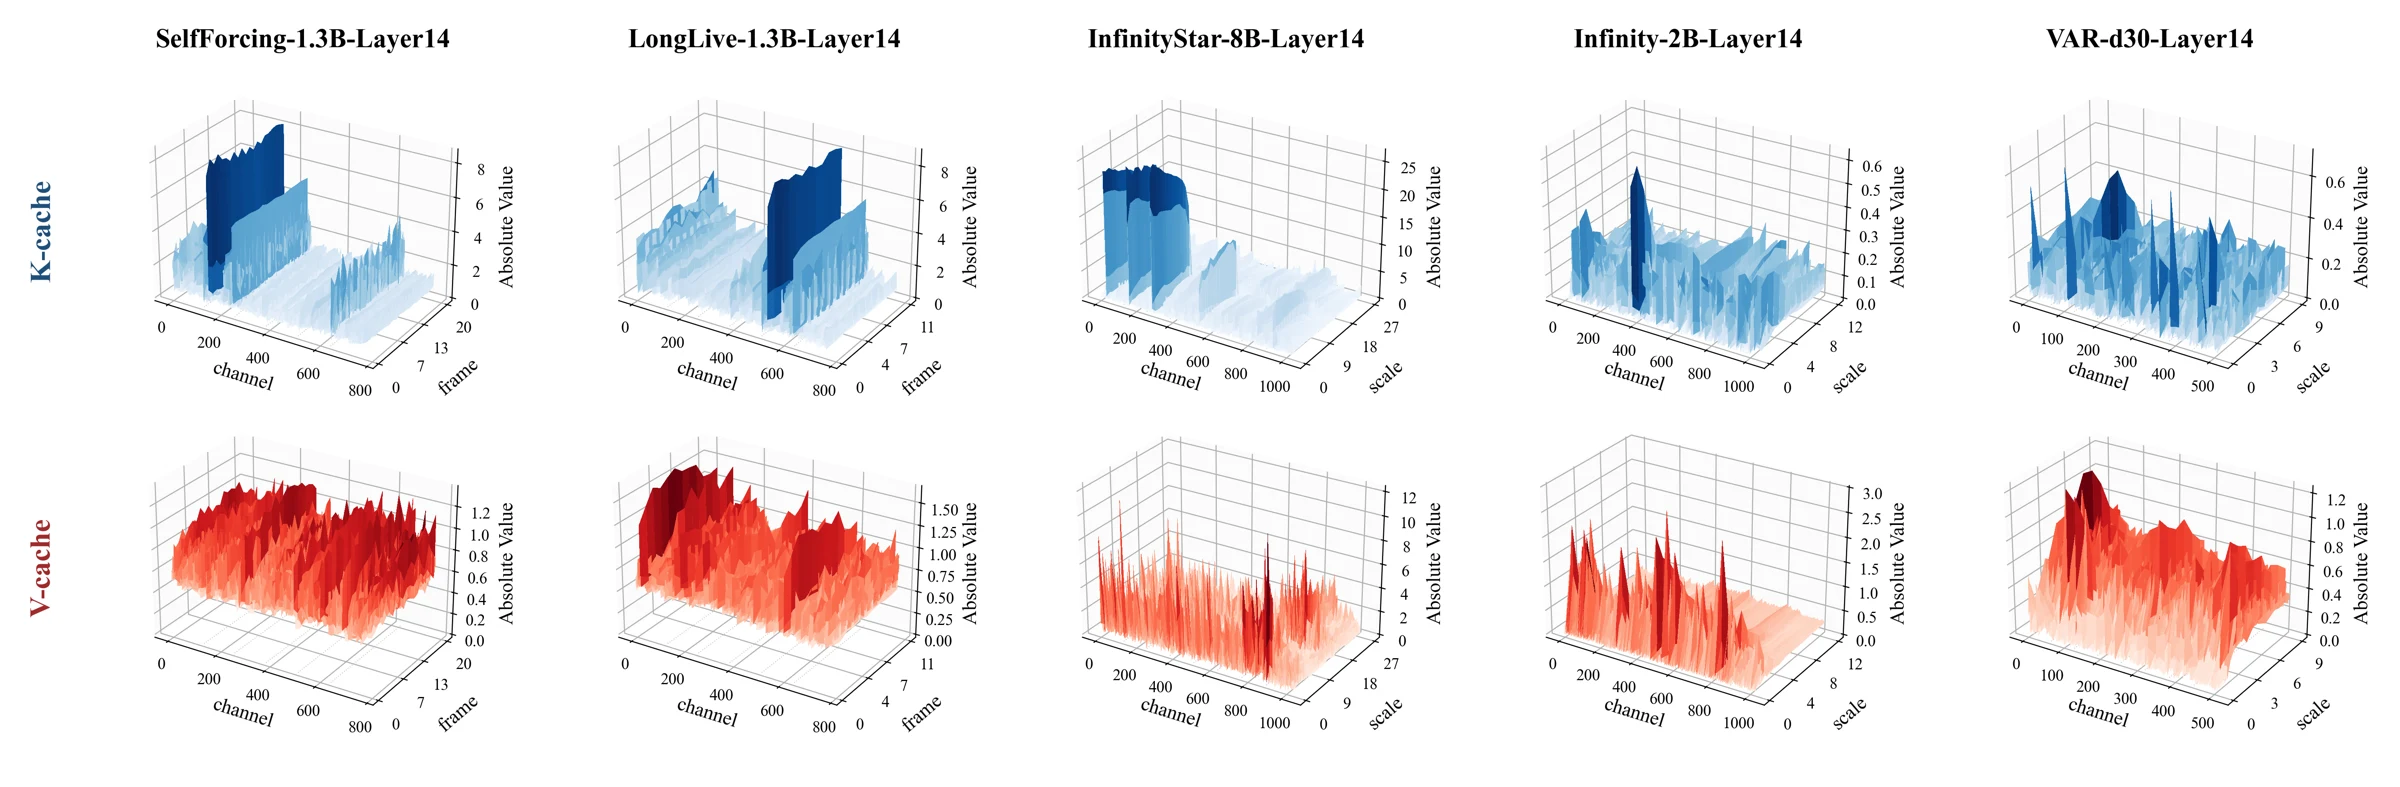
Seen this way, both paradigms leave behind the same object: a KV cache indexed by feature channel and generation block. Its magnitudes share a channel × block structure: a small set of channels carries large values, and their magnitudes shift from block to block.
Why it matters for quantization. VAR-Q assigns one scale factor per channel within each block, reusing the block boundaries the generation loop already provides. No outlier detection, no calibration data, no retraining.

While §3.2 establishes where massive outliers concentrate, this section investigates why they emerge. We attribute these structural anomalies along the channel and block axes to specific operations within the K and V projection chains (§3.3). Appendix A separates the roles of K and V across modalities.
K Persistence@10 at p = 1%, a hard architectural core shared across inputs; V sits at 0.07–0.14.
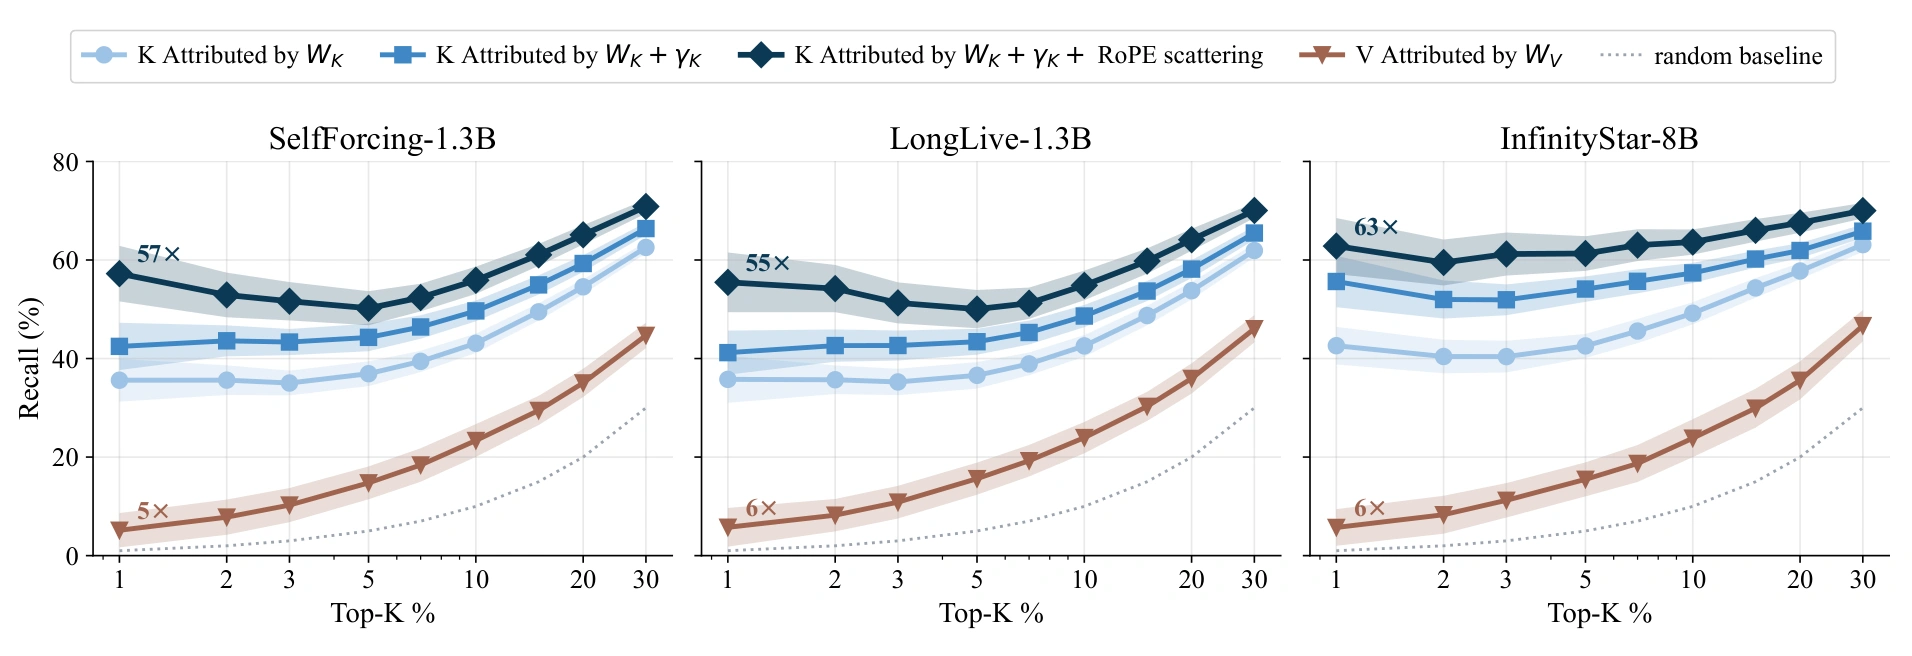
Observation · K outliers are architectural and V outliers are largely input-driven 02 55–63×random recall of final K outliers from the WK → γK → RoPE chain; WV alone yields 5–6×.
Insight · A compounding architectural effect on K-cache channel outliers 03 +0.41VBench Total Quality from quantizing the post-RoPE cache instead of the pre-RoPE cache, at the same 27.5 GB (Table 7).
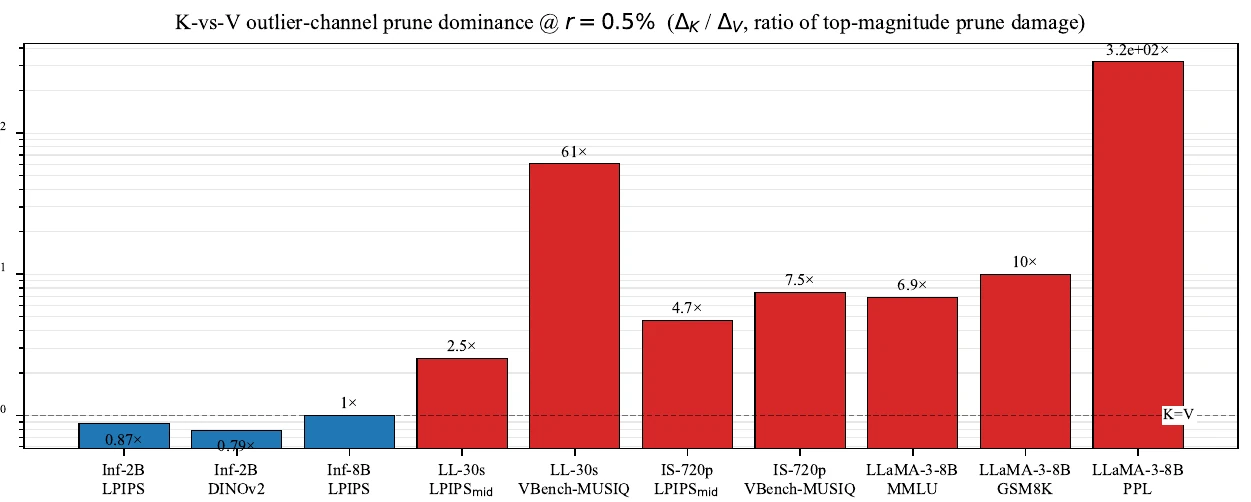
Insight · Block-axis dynamics generated by RoPE periodicity 04 61×ΔK/ΔV damage ratio on LongLive-30s at p = 0.5%; Infinity-2B sits at 0.79–0.87×.
Observation · Video models are more sensitive to K outliers, image models to V outliers01 · Observation · Cross-prompt persistence
Whether an outlier is architectural or input-driven can be tested empirically through cross-prompt persistence: an architectural outlier should persist across prompts, while an input-driven outlier should drift. We sample N prompts across models and define outliers as the top-p channels by magnitude. Persistence@N is the fraction of a single prompt’s outlier channels that remain outliers under all N prompts (random ≈ 0).
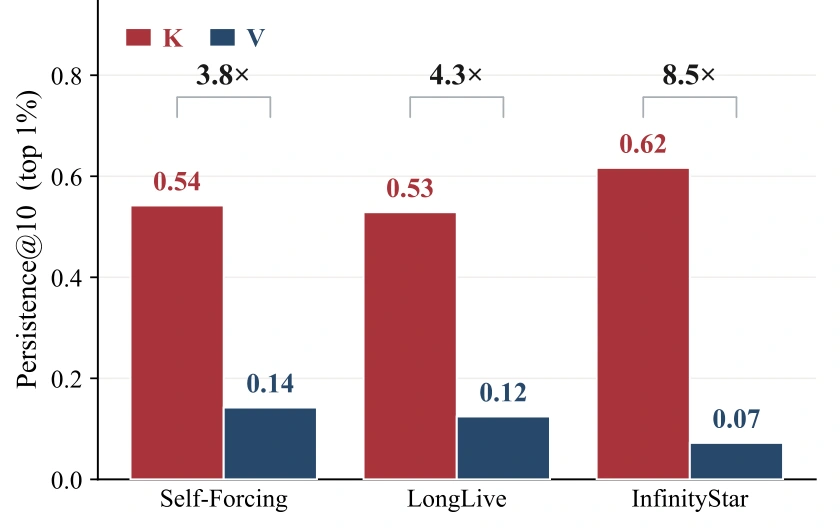
At N = 10, p = 1%, K Persistence@10 reaches 0.53–0.62, a hard architectural core shared across inputs; V sits at 0.07–0.14, a 3.8×–8.5× gap (Fig. 5). V’s near-vanishing persistence indicates input activations dominate V outlier identity.
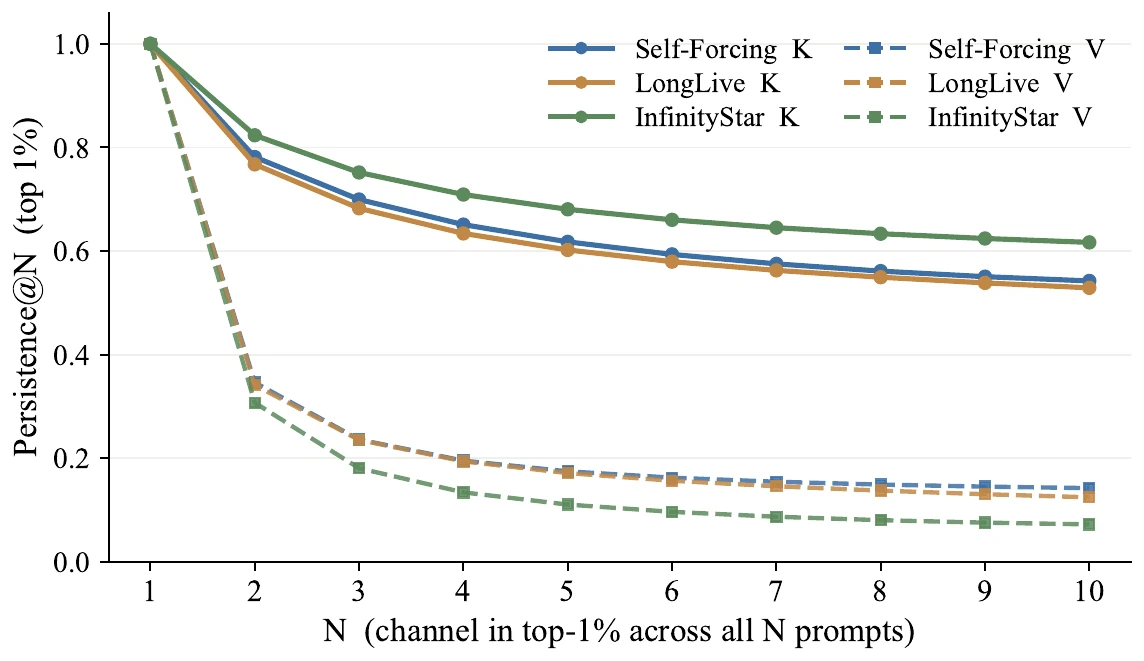
The shapes of the K and V curves differ qualitatively, not just in magnitude. V (dashed) collapses on the first added prompt: even a single second prompt removes about two-thirds of the outlier channels (Persistence@2 = 0.31 to 0.35 across the three backbones), and the curve continues to decay toward 0.07 to 0.14. K (solid) instead bends gently, retaining 0.77 to 0.82 at N = 2 and asymptoting at 0.53 to 0.62. The plateau shape on K is the signature of an architectural core: most outlier channels survive every additional prompt, consistent with their being selected by the static WK, γK, and RoPE-pair chain. The crash on V is the signature of input-driven outliers: each new prompt is a fresh sample of token amplitudes, and the V channel identity tracks those samples.
02 · Insight · The channel axis
We attribute these structural anomalies along the channel and block axes to specific operations within the K and V projection chains. Formally, we decompose the generation of Kt and Vt as follows:
The architectural core of K identified above arises from three multiplicative sources along the projection chain (Eq. 2): (i) heavy-tailed row norms of WK seed an initial outlier baseline; (ii) where RMSNorm-K is present, the channel gain γK amplifies this baseline; and (iii) RoPE rotates each (2i, 2i+1) pair, redistributing energy between the two channels while preserving the pair’s ℓ2 norm.
Heavy-tailed row norms of WK seed an initial outlier baseline.
Where RMSNorm-K is present, the channel gain γK amplifies this baseline.
RoPE rotates each (2i, 2i+1) pair, redistributing energy between the two channels while preserving the pair’s ℓ2 norm.
We quantify this compounding by progressively adding components and measuring the recall of final K outliers (Fig. 6). At p = 1%, WK alone recovers 35–42% (35–42× random); adding γK lifts recall further; the full chain reaches 55–63× random. In contrast, WV alone yields 5–6× random recall on every model, an order of magnitude weaker than the K chain.
03 · Insight · The block axis
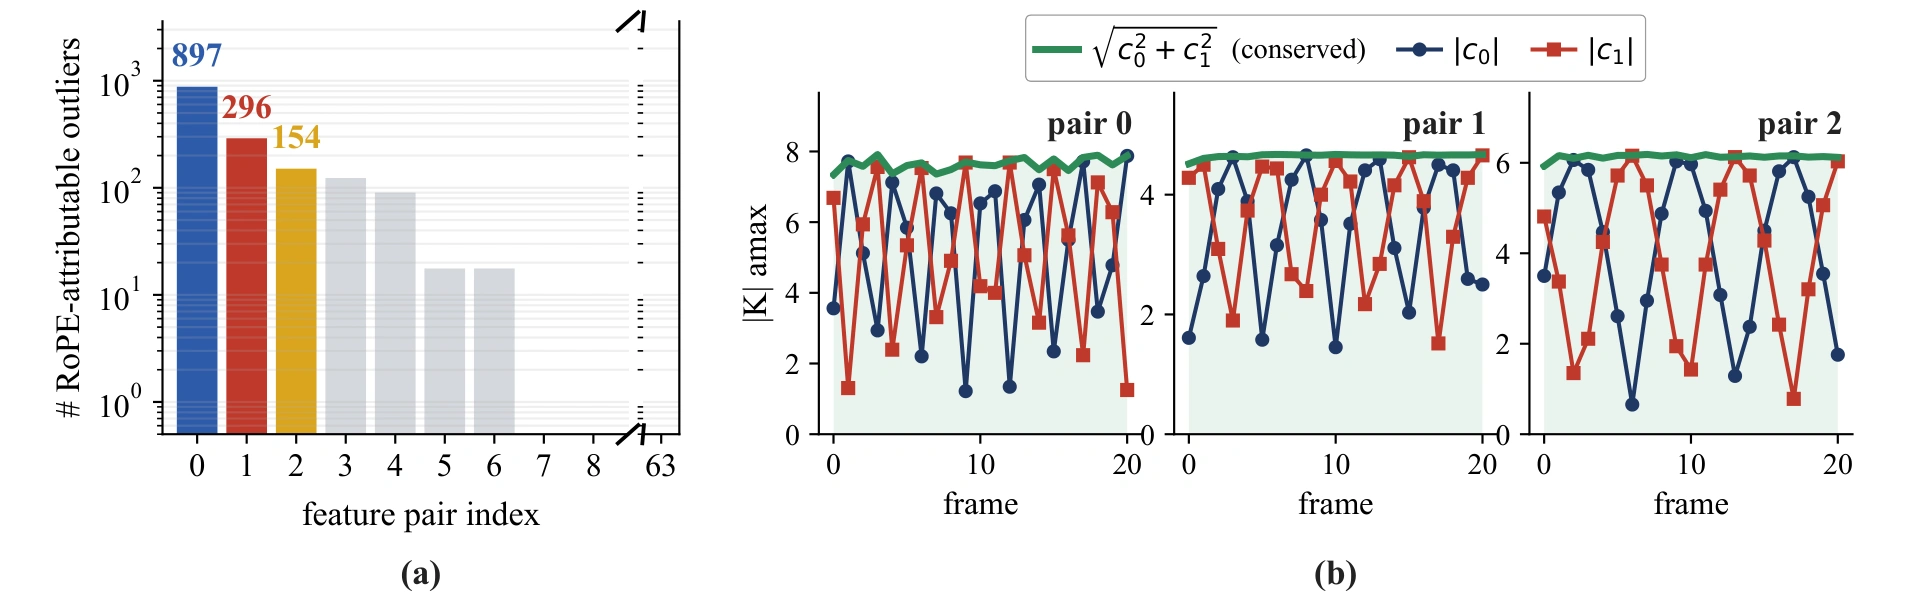
A class of K block-axis outliers is generated by RoPE alone, independent of input dynamics. RoPE rotates each channel pair (2i, 2i+1) at frequency ωi by an angle (bωi) along the pair’s RoPE axis, where b is the block index. Within block b, every token shares the same rotation, and per-token magnitudes are
Two consequences follow and are visible in Fig. 7. (i) Pair envelope is approximately block-invariant. RoPE preserves the per-token pair ℓ2 exactly, and in the massive-value regime this carries over to the pair of channel maxes (Appendix C). The two channels move in anti-phase within each block. (ii) Fast pairs dominate the block axis. The total angle a pair traverses across the block sequence determines its swing: slow pairs barely rotate and stay flat, fast pairs complete multiple cycles and produce block bands.
Appendix CWhy the pair envelope stays flat: approximate ℓ2 invariance of channel maxima under RoPE
Within one block of T tokens, let the pair (ct, dt) at token t have pre-RoPE amplitude Mt = √(ct2 + dt2), with order statistics M(1) ≥ M(2) ≥ ⋯ ≥ M(T). After RoPE rotation by the shared block angle θ, write at = Mt cos(θ + φt) and bt = Mt sin(θ + φt), where φt is the per-token pre-RoPE angle. The pair of channel maxima satisfies
M(1)2 ≤ ‖a‖∞2 + ‖b‖∞2 ≤ M(1)2 + M(2)2.(4)
Lower bound. Let t⋆ = arg maxt Mt. Per-token RoPE invariance gives at⋆2 + bt⋆2 = M(1)2. Since ‖a‖∞ ≥ |at⋆| and ‖b‖∞ ≥ |bt⋆|, the sum is at least M(1)2.
Upper bound. Let ta = arg maxt |at| and tb = arg maxt |bt|. Per token, |at|, |bt| ≤ Mt, so ‖a‖∞2 ≤ Mta2 and ‖b‖∞2 ≤ Mtb2. If ta = tb, the sum equals Mta2 ≤ M(1)2. If ta ≠ tb, at least one of them is not t⋆, so min(Mta, Mtb) ≤ M(2) and the sum is at most M(1)2 + M(2)2. ∎
Massive-value regime. When pre-RoPE amplitudes are heavy-tailed within the block, M(2)2 ≪ M(1)2 and the two bounds collapse: the channel-max pair ℓ2 is approximately invariant under RoPE rotation. This is the mathematical basis for the flat envelope in Figure 7(b), while the individual maxima ‖a‖∞ and ‖b‖∞ trade magnitude as θ advances from block to block.
Pre-RoPE vs. post-RoPE quantization (Appendix F). Post-RoPE quantization consistently outperforms pre-RoPE on the metrics most related to temporal behavior and overall generation quality: Subject Consistency, Background Consistency, Dynamic Degree, Aesthetic Quality, and Total Quality (83.34 vs. 82.93 on Self-Forcing at INT6, same 27.50 GB KV cache, Table 7). This supports quantizing the final post-RoPE cache, which is directly consumed by attention, rather than the pre-RoPE cache. We therefore use post-RoPE quantization as the default.
04 · Observation · Asymmetric roles of K and V across modalities
The joint result of §3.1 masks a per-tensor split: video models are more sensitive to K outliers, while image models are more sensitive to V outliers. Mechanistically, K determines which past tokens are attended to and V determines what content is retrieved. The split therefore suggests that video generation places a heavier demand on precise temporal addressing into the cache, whereas image generation tolerates coarser addressing but depends more on the fidelity of the content retrieved at each cached position.
Image AR is V-dominant: on Infinity-2B at p = 5%, V-only ablation drives ΔLPIPS to 0.20 against 0.08 for K-only, and the LAION aesthetic score drops by 1.3 under V-only against near-zero under K-only. Video AR reverses the direction: on LongLive-30s at p = 5%, K-only ablation drives ΔLPIPSmid to 0.40 against 0.14 for V-only, and the same direction holds on InfinityStar-720p. The image-side V-dominance is consistent across both Infinity backbones and the video-side K-dominance across both video backbones, indicating that the asymmetry tracks the modality rather than per-model idiosyncrasy.
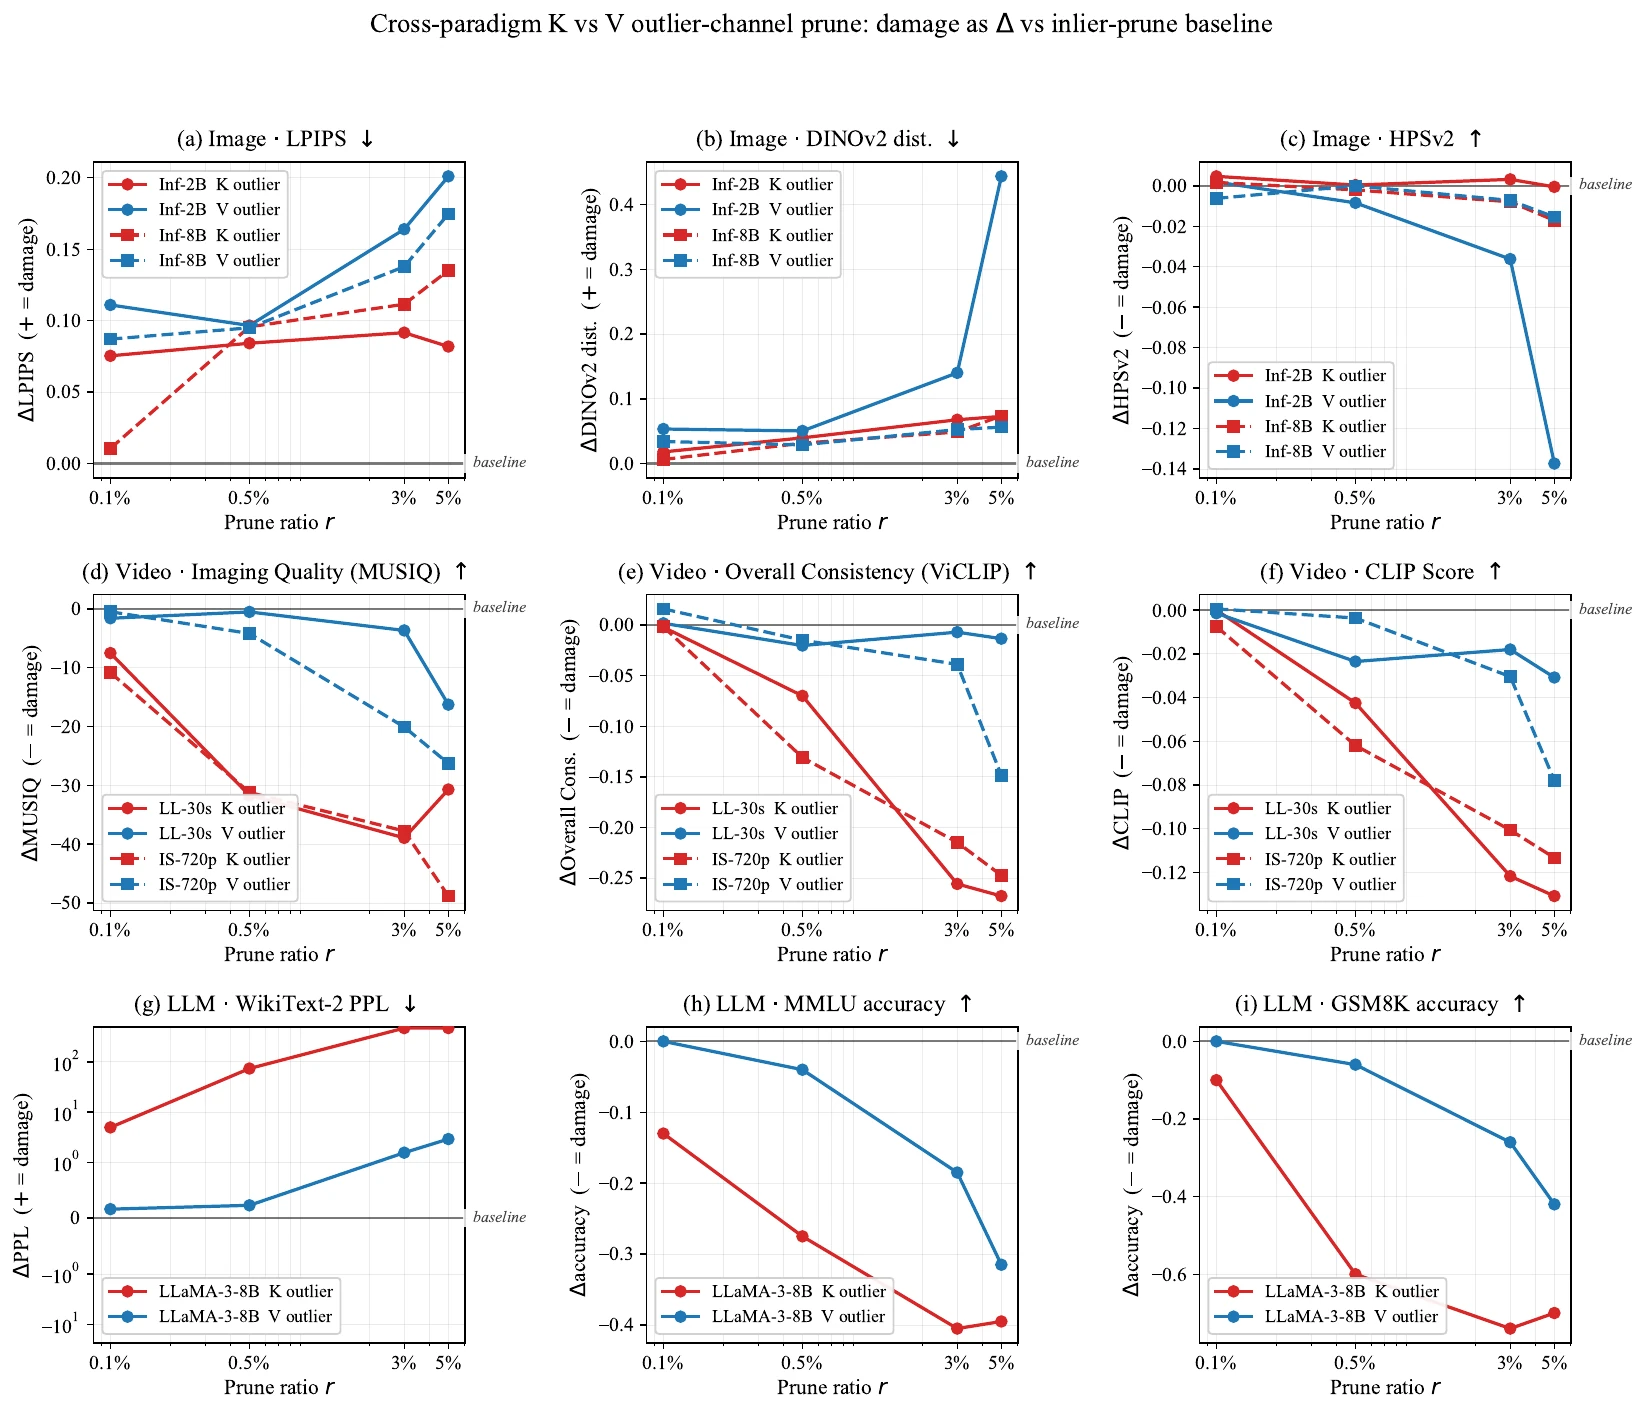
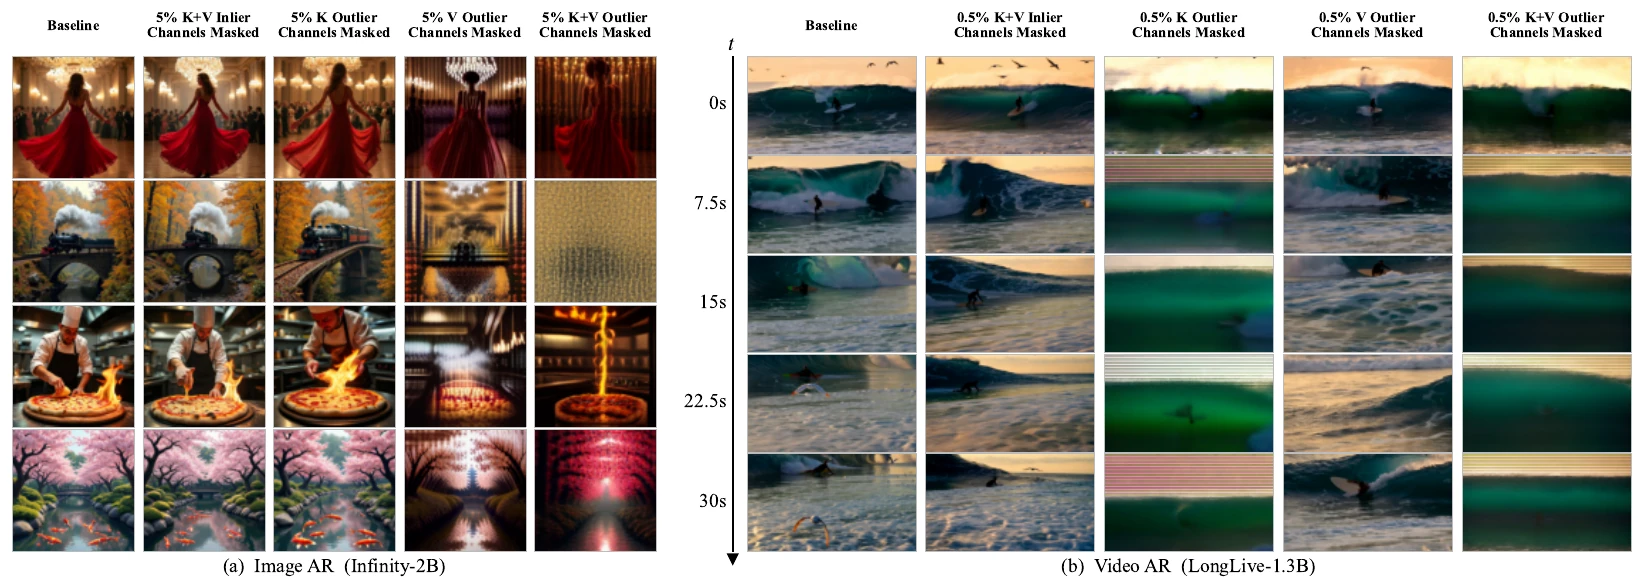
The same protocol on LLaMA-3-8B-Instruct behaves like video AR in direction but more sharply in magnitude: at p = 0.5%, K-only ablation increases WikiText-2 perplexity from 8.4 to 82.4 (∼10×), while V-only ablation leaves it at 11.5 (1.4×); MMLU and GSM8K accuracy degrade in the same direction. Figure 12 summarizes the damage ratio ΔK/ΔV at p = 0.5%: image AR sits at or below 1×, video AR ranges from 2.5× to 61×, and LLaMA-3-8B reaches 320× on perplexity.
A channel × block view of the KV cache
explains where quantization groups belong.
Masking just the top 0.5% of channels in LongLive collapses generation. Masking ten times as many inlier channels leaves quality largely intact.
Large magnitudes persist along feature channels and shift across generation blocks. Grouping along only one axis misses part of the structure.
A scale or frame defines a block. VAR-Q reuses these boundaries, with no outlier detection, calibration data, or retraining.
VAR-Q separates feature channels and generation blocks, so each group follows both axes of the cache.
Illustrative grouping diagram. Colors are schematic, not measured activations.
Attention-output error falls from 32.32% to 10.13% when moving from per-tensor to channel × block grouping. The joint rule has the lowest error in every reported column.
| Grouping | K error ↓ | V error ↓ | Attention error ↓ | Output error ↓ |
|---|---|---|---|---|
| Per-tensor | 24.01 | 43.54 | 29.20 | 32.32 |
| Per-block | 21.59 | 32.93 | 26.36 | 22.78 |
| Per-channel | 12.11 | 18.07 | 16.17 | 13.13 |
| Channel × block | 10.04 | 15.28 | 13.38 | 10.13 |
Relative Frobenius error: εX = ‖X − X′‖F / ‖X‖F. Joint grouping gives the lowest error in all four columns. Source ↗
Removing the channel axis sharply degrades generation. Keeping channels but removing block boundaries also loses quality—on both a next-scale and a next-frame model.
| Grouping | VAR-d30 FID ↓ |
Self-Forcing VBench Total ↑ |
|---|---|---|
| Channel × block | 1.97 | 80.99 |
| Without block axis | 2.83 | 79.38 |
| Without channel axis | 12.07 | 67.22 |
Metrics are compared within each column. Full ablation →
| Grouping | VAR FID ↓ | IS ↑ | PSNR ↑ | SSIM ↑ | LPIPS ↓ | VAR KV (GB) ↓ | SF Subject ↑ | Dynamic ↑ | Aesthetic ↑ | Total ↑ | SF KV (GB) ↓ |
|---|---|---|---|---|---|---|---|---|---|---|---|
| Without block axis | 2.83 | 292.13 | 12.07 | 0.257 | 0.538 | 9.45 | 88.49 | 69.00 | 54.51 | 79.38 | 16.90 |
| Without channel axis | 12.07 | 159.52 | 10.42 | 0.198 | 0.645 | 9.34 | 79.17 | 27.00 | 33.86 | 67.22 | 16.87 |
| Per-token & per-head | 2.21 | 292.12 | 11.97 | 0.261 | 0.545 | 10.51 | 90.18 | 67.00 | 54.96 | 79.46 | 17.93 |
| Per-token | 7.13 | 203.50 | 10.51 | 0.208 | 0.635 | 9.38 | 78.55 | 25.50 | 39.51 | 67.72 | 16.96 |
| VAR-Q (full) | 1.97 | 323.67 | 13.54 | 0.312 | 0.437 | 10.44 | 91.28 | 75.50 | 57.40 | 80.99 | 16.95 |
Same number and sizes of groups, shifted by half a block: misalignment lowers Self-Forcing quality by 0.45 points in this controlled experiment.
| Boundary placement | Subject ↑ | Dynamic ↑ | Aesthetic ↑ | Quality ↑ |
|---|---|---|---|---|
| Misaligned | 90.80 | 73.50 | 56.75 | 80.46 |
| Aligned | 91.23 | 74.50 | 57.41 | 80.91 |
Table 6 is a separate alignment experiment; its aligned score is not substituted for Table 5’s full-method score. Source ↗
VAR-Q quantizes the cache per channel and block, then packs low-bit values into INT32 storage. Before attention, cached values are unpacked and dequantized to BF16. Packing turns reduced precision into real KV-memory savings.
Read the algorithm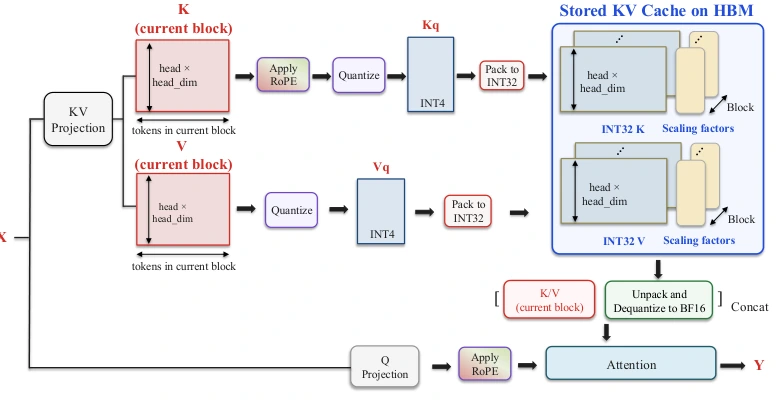
Infinity-8B at a 2-bit KV cache: BF16, FlexGen, KIVI and VAR-Q from the same prompt and seed. Click an image to enlarge. Paired BF16 vs. VAR-Q videos are in the comparisons at the top of the page.
At 2 bits the KV cache shrinks by 87%; VAR-Q keeps the BF16 subject and layout while KIVI and FlexGen drift or break. KV memory is the paper's measurement at the evaluation batch size.
Quality and KV memory as reported in the paper, with batch size and precision stated next to every number.
InfinityStar: 80.59 VBench vs. 82.33 BF16.
LongLive: 80.94 VBench vs. 80.92 BF16.
Self-Forcing: 80.99 VBench vs. 82.94 BF16.
Compare KV memory and VBench Total Quality at the same precision and batch size. BF16 provides the reference for each model.
Next-scale video · INT3
| Method | KV · GB ↓ | VBench ↑ |
|---|---|---|
| BF16 | 62.72 | 82.33 |
| FlexGen | 13.56 | 79.95 |
| KIVI | 13.81 | 75.46 |
| VAR-Q | 13.08 | 80.59 |
Next-frame video · INT6
| Method | KV · GB ↓ | VBench ↑ |
|---|---|---|
| BF16 | 67.49 | 82.94 |
| FlexGen | 27.95 | 82.98 |
| KIVI | 28.22 | 82.85 |
| VAR-Q | 27.50 | 83.34 |
Next-frame video · INT6
| Method | KV · GB ↓ | VBench ↑ |
|---|---|---|
| BF16 | 64.28 | 80.92 |
| FlexGen | 26.62 | 80.60 |
| KIVI | 26.88 | 80.65 |
| VAR-Q | 26.19 | 80.94 |
Five model families, nine checkpoints: VAR-d20/d24/d30, Infinity-2B/8B, InfinityStar 480p/720p, Self-Forcing and LongLive. VAR-Q retains competitive generation quality while reducing KV memory by 72–75%.
| Model / setting | Quality metric | BF16 | VAR-Q · INT4 | KV (GB) · BF16 → VAR-Q | KV saved |
|---|---|---|---|---|---|
| VAR-d20Next-scale | FID ↓ | 4.11 | 3.44 | 16.60 → 4.64 | 72.06% |
| VAR-d24Next-scale | FID ↓ | 2.97 | 2.52 | 23.91 → 6.68 | 72.06% |
| VAR-d30Next-scale | FID ↓ | 2.07 | 1.97 | 37.35 → 10.44 | 72.06% |
| Infinity-2BNext-scale | GenEval Overall ↑ | 69.61 | 69.35 | 41.10 → 10.38 | 74.75% |
| Infinity-8BNext-scale | GenEval Overall ↑ | 83.54 | 83.67 | 67.43 → 17.03 | 74.75% |
| InfinityStar · 720pNext-scale | Total Quality ↑ | 82.33 | 81.66 | 62.72 → 16.00 | 74.49% |
| InfinityStar · 480pNext-scale | Total Quality ↑ | 81.30 | 81.32 | 55.87 → 14.60 | 73.86% |
| Self-ForcingNext-frame | Total Quality ↑ | 82.94 | 80.99 | 67.49 → 16.95 | 74.88% |
| LongLiveNext-frame | Total Quality ↑ | 80.92 | 79.60 | 64.28 → 16.15 | 74.88% |
FID ↓ for VAR; GenEval Overall ↑ for Infinity; VBench Total Quality ↑ for video models. Full metrics, precisions, and baselines are reproduced below.
Every precision, metric and baseline (BF16, FlexGen, KIVI) from Tables 2–4. Open a table to expand it.
At 720p with INT3 caches, VAR-Q scores 80.59 on VBench Total Quality, compared with 79.95 for FlexGen and 75.46 for KIVI, while reducing KV memory by 79.15% relative to BF16.
| Model | KV precision | Total Quality ↑ | Δ vs. BF16 | KV (GB) ↓ | KV reduction |
|---|---|---|---|---|---|
| InfinityStar 720p | INT4 | 81.66 | -0.67 | 16.00 | 74.49% |
| InfinityStar 720p | INT3 | 80.59 | -1.74 | 13.08 | 79.15% |
| InfinityStar 480p | INT4 | 81.32 | +0.02 | 14.60 | 73.86% |
| InfinityStar 480p | INT3 | 80.98 | -0.32 | 12.03 | 78.47% |
| Method | KV precision | VBench ↑ | KV cache | ||||||||
|---|---|---|---|---|---|---|---|---|---|---|---|
| Subject Consistency | Background Consistency | Temporal Flickering | Motion Smoothness | Dynamic Degree | Aesthetic Quality | Imaging Quality | Total Quality | Memory (GB) ↓ | Reduction (%) ↑ | ||
| InfinityStar · Next-scale video · 720p / 8B · 720p · batch 3 | |||||||||||
| Baseline | BF16 | 93.69 | 94.62 | 97.71 | 98.86 | 67.50 | 58.49 | 66.79 | 82.33 | 62.72 | — |
| FlexGen | INT4 | 93.83 | 94.76 | 97.83 | 98.91 | 63.00 | 55.50 | 64.80 | 80.11 | 16.48 | 73.72% |
| KIVI | INT4 | 92.01 | 94.61 | 97.27 | 98.70 | 68.00 | 56.12 | 63.60 | 81.24 | 16.73 | 73.33% |
| VAR-Q | INT4 | 92.65 | 94.09 | 97.37 | 98.59 | 74.50 | 56.87 | 64.35 | 81.66 | 16.00 | 74.49% |
| FlexGen | INT3 | 90.12 | 92.68 | 97.84 | 96.91 | 62.00 | 56.01 | 60.48 | 79.95 | 13.56 | 78.37% |
| KIVI | INT3 | 90.45 | 90.42 | 97.65 | 96.79 | 74.00 | 50.97 | 61.92 | 75.46 | 13.81 | 77.99% |
| VAR-Q | INT3 | 91.41 | 93.56 | 97.25 | 98.37 | 75.00 | 55.55 | 61.75 | 80.59 | 13.08 | 79.15% |
| InfinityStar · Next-scale video · 480p / 8B · 480p · batch 6 | |||||||||||
| Baseline | BF16 | 93.01 | 94.53 | 97.25 | 98.68 | 66.00 | 58.13 | 64.01 | 81.30 | 55.87 | — |
| FlexGen | INT4 | 90.59 | 94.39 | 95.16 | 98.64 | 66.50 | 56.48 | 62.14 | 78.94 | 15.03 | 73.10% |
| KIVI | INT4 | 92.44 | 94.42 | 96.65 | 97.79 | 64.00 | 56.97 | 62.92 | 80.46 | 15.25 | 72.71% |
| VAR-Q | INT4 | 92.75 | 94.51 | 97.21 | 98.67 | 68.50 | 57.84 | 63.62 | 81.32 | 14.60 | 73.86% |
| FlexGen | INT3 | 91.89 | 93.91 | 97.24 | 98.62 | 64.00 | 57.54 | 63.69 | 80.64 | 12.45 | 77.71% |
| KIVI | INT3 | 93.01 | 94.46 | 97.33 | 98.71 | 64.00 | 57.79 | 63.56 | 78.05 | 12.67 | 77.33% |
| VAR-Q | INT3 | 92.86 | 94.30 | 97.26 | 98.64 | 65.50 | 57.52 | 63.37 | 80.98 | 12.03 | 78.47% |
Bold and underline mark the best and second-best quality scores among quantized methods at the same precision, within each model. BF16 is the reference. ↑ Higher is better; ↓ lower is better. Memory reduction is relative to BF16 at the listed batch size.
At INT6, VAR-Q stays close to BF16 on VBench Total Quality for both 5-second and 30-second videos. INT4 reduces KV memory by 74.88%, with quality drops of 1.95 and 1.32 points, respectively.
| Model | KV precision | Total Quality ↑ | Δ vs. BF16 | KV (GB) ↓ | KV reduction |
|---|---|---|---|---|---|
| Self-Forcing | INT6 | 83.34 | +0.40 | 27.50 | 59.25% |
| Self-Forcing | INT4 | 80.99 | -1.95 | 16.95 | 74.88% |
| LongLive | INT6 | 80.94 | +0.02 | 26.19 | 59.25% |
| LongLive | INT4 | 79.60 | -1.32 | 16.15 | 74.88% |
| Method | KV precision | VBench ↑ | Claude Opus 4.7 · VLM judge ↑ (1–5) | KV cache | ||||||||
|---|---|---|---|---|---|---|---|---|---|---|---|---|
| Subject Consistency | Background Consistency | Motion Smoothness | Dynamic Degree | Aesthetic Quality | Total Quality | Visual Quality | Dynamics | Text Alignment | Memory (GB) ↓ | Reduction (%) ↑ | ||
| Self-Forcing · Next-frame video / 1.3B · 5-second clips · batch 12 | ||||||||||||
| Baseline | BF16 | 93.57 | 94.07 | 98.43 | 75.00 | 60.07 | 82.94 | 3.81 | 3.10 | 3.62 | 67.49 | — |
| FlexGen | INT6 | 93.52 | 94.11 | 98.44 | 76.00 | 60.02 | 82.98 | 3.79 | 3.15 | 3.73 | 27.95 | 58.59% |
| KIVI | INT6 | 93.58 | 94.12 | 98.49 | 73.00 | 60.07 | 82.85 | 3.82 | 3.14 | 3.63 | 28.22 | 58.18% |
| VAR-Q | INT6 | 93.96 | 94.76 | 98.49 | 76.50 | 61.25 | 83.34 | 3.89 | 3.17 | 3.62 | 27.50 | 59.25% |
| FlexGen | INT4 | 86.39 | 85.84 | 95.40 | 73.00 | 57.39 | 75.91 | 3.60 | 3.40 | 3.75 | 17.40 | 74.22% |
| KIVI | INT4 | 90.53 | 91.86 | 98.29 | 74.50 | 57.64 | 80.33 | 3.54 | 3.44 | 3.76 | 17.68 | 73.81% |
| VAR-Q | INT4 | 91.28 | 92.55 | 98.35 | 75.50 | 57.40 | 80.99 | 3.55 | 3.50 | 3.73 | 16.95 | 74.88% |
| LongLive · Next-frame video / 1.3B · 30-second clips · batch 20 | ||||||||||||
| Baseline | BF16 | 91.44 | 93.83 | 98.94 | 44.50 | 60.74 | 80.92 | 3.75 | 3.25 | 3.69 | 64.28 | — |
| FlexGen | INT6 | 91.33 | 93.49 | 98.95 | 46.50 | 60.29 | 80.60 | 3.78 | 3.33 | 3.78 | 26.62 | 58.59% |
| KIVI | INT6 | 91.14 | 93.45 | 98.94 | 43.50 | 60.36 | 80.65 | 3.73 | 3.27 | 3.70 | 26.88 | 58.18% |
| VAR-Q | INT6 | 91.26 | 93.57 | 98.93 | 47.50 | 60.17 | 80.94 | 3.84 | 3.31 | 3.71 | 26.19 | 59.25% |
| FlexGen | INT4 | 86.72 | 90.19 | 95.83 | 45.00 | 55.16 | 76.59 | 3.48 | 3.48 | 3.77 | 16.57 | 74.22% |
| KIVI | INT4 | 85.83 | 92.09 | 97.80 | 49.50 | 56.59 | 78.95 | 3.48 | 3.55 | 3.79 | 16.84 | 73.81% |
| VAR-Q | INT4 | 88.39 | 91.97 | 98.80 | 47.50 | 57.11 | 79.60 | 3.54 | 3.57 | 3.80 | 16.15 | 74.88% |
Bold and underline mark the best and second-best quality scores among quantized methods at the same precision, within each model. BF16 is the reference. ↑ Higher is better; ↓ lower is better. Memory reduction is relative to BF16 at the listed batch size.
VLM evaluation uses Claude Opus 4.7 (Opus4.7-VL in the paper). The judge rates visual quality, dynamics, and text alignment on a 1–5 scale using 12 uniformly sampled frames and the generation prompt. These ratings are separate from VBench scores.
FID measures the output distribution; PSNR, SSIM, and LPIPS measure fidelity to matched-seed BF16 outputs. Both are needed to judge quantization.
| Method | KV precision | Distribution quality | Fidelity to BF16 | KV cache | ||||||
|---|---|---|---|---|---|---|---|---|---|---|
| FID ↓ | IS ↑ | Precision ↑ | Recall ↑ | PSNR ↑ | SSIM ↑ | LPIPS ↓ | Memory (GB) ↓ | Reduction (%) ↑ | ||
| VAR-d20 · Next-scale image / 600M · ImageNet 256×256 · batch 128 | ||||||||||
| Baseline | BF16 | 4.11 | 357.32 | 0.8650 | 0.5160 | — | — | — | 16.60 | — |
| FlexGen | INT4 | 4.03 | 325.39 | 0.8326 | 0.5230 | 11.84 | 0.264 | 0.553 | 4.29 | 74.14% |
| KIVI | INT4 | 3.55 | 341.52 | 0.8458 | 0.5363 | 11.81 | 0.256 | 0.552 | 4.65 | 71.97% |
| VAR-Q | INT4 | 3.44 | 342.77 | 0.8502 | 0.5281 | 13.22 | 0.308 | 0.462 | 4.64 | 72.06% |
| FlexGen | INT3 | 15.33 | 139.59 | 0.5944 | 0.6308 | 10.35 | 0.212 | 0.650 | 3.46 | 79.14% |
| KIVI | INT3 | 6.36 | 233.84 | 0.7260 | 0.5748 | 9.88 | 0.187 | 0.662 | 3.82 | 76.97% |
| VAR-Q | INT3 | 3.77 | 262.24 | 0.7706 | 0.5767 | 12.24 | 0.266 | 0.538 | 3.81 | 77.06% |
| VAR-d24 · Next-scale image / 1.0B · ImageNet 256×256 · batch 128 | ||||||||||
| Baseline | BF16 | 2.97 | 357.24 | 0.8444 | 0.5605 | — | — | — | 23.91 | — |
| FlexGen | INT4 | 2.74 | 325.69 | 0.8175 | 0.5816 | 11.78 | 0.256 | 0.560 | 6.18 | 74.14% |
| KIVI | INT4 | 2.56 | 340.55 | 0.8295 | 0.5786 | 11.92 | 0.268 | 0.545 | 6.70 | 71.97% |
| VAR-Q | INT4 | 2.52 | 341.60 | 0.8321 | 0.5718 | 13.03 | 0.296 | 0.479 | 6.68 | 72.06% |
| FlexGen | INT3 | 14.91 | 144.09 | 0.6066 | 0.6424 | 10.63 | 0.201 | 0.643 | 4.99 | 79.14% |
| KIVI | INT3 | 4.29 | 239.40 | 0.7271 | 0.6340 | 10.88 | 0.226 | 0.631 | 5.51 | 76.97% |
| VAR-Q | INT3 | 3.60 | 258.33 | 0.7477 | 0.6130 | 11.90 | 0.252 | 0.558 | 5.48 | 77.06% |
| VAR-d30 · Next-scale image / 2.0B · ImageNet 256×256 · batch 128 | ||||||||||
| Baseline | BF16 | 2.07 | 335.10 | 0.8260 | 0.5812 | — | — | — | 37.35 | — |
| FlexGen | INT4 | 2.00 | 307.92 | 0.8061 | 0.6006 | 12.47 | 0.277 | 0.510 | 9.66 | 74.14% |
| KIVI | INT4 | 1.99 | 321.46 | 0.8162 | 0.5974 | 12.86 | 0.290 | 0.484 | 10.47 | 71.97% |
| VAR-Q | INT4 | 1.97 | 323.67 | 0.8156 | 0.5961 | 13.54 | 0.312 | 0.437 | 10.44 | 72.06% |
| FlexGen | INT3 | 9.52 | 180.57 | 0.6738 | 0.6417 | 11.33 | 0.232 | 0.597 | 7.79 | 79.14% |
| KIVI | INT3 | 3.26 | 264.93 | 0.7536 | 0.6189 | 11.69 | 0.249 | 0.573 | 8.60 | 76.97% |
| VAR-Q | INT3 | 3.05 | 268.16 | 0.7612 | 0.6307 | 12.41 | 0.270 | 0.517 | 8.57 | 77.06% |
Bold and underline mark the best and second-best quality scores among quantized methods at the same precision, within each model. BF16 is the reference. ↑ Higher is better; ↓ lower is better. Memory reduction is relative to BF16 at the listed batch size.
GenEval measures compositional prompt following, while DPG evaluates finer-grained alignment. Infinity-8B retains a DPG Overall score of 83.83 at INT2, using 8.60 GB of KV memory versus 67.43 GB for BF16.
| Method | KV precision | GenEval ↑ | DPG ↑ | KV cache | |||||||||
|---|---|---|---|---|---|---|---|---|---|---|---|---|---|
| Two-Object | Position | Color | Overall | Entity | Relation | Attribute | Global | Other | Overall | Memory (GB) ↓ | Reduction (%) ↑ | ||
| Infinity-2B · Next-scale image / Text-to-image · batch 8 | |||||||||||||
| Baseline | BF16 | 80.61 | 25.51 | 88.03 | 69.61 | 86.55 | 89.51 | 86.62 | 83.24 | 90.14 | 81.97 | 41.10 | — |
| VAR-Q | INT8 | 79.34 | 26.26 | 87.23 | 69.06 | 87.69 | 89.39 | 88.70 | 86.40 | 85.85 | 82.21 | 20.65 | 49.75% |
| FlexGen | INT4 | 78.57 | 24.75 | 54.50 | 67.75 | 87.39 | 91.56 | 85.38 | 82.24 | 82.04 | 81.01 | 10.60 | 74.22% |
| KIVI | INT4 | 80.61 | 24.49 | 87.23 | 67.48 | 88.18 | 91.13 | 86.51 | 83.18 | 80.81 | 80.04 | 10.78 | 73.76% |
| VAR-Q | INT4 | 79.34 | 26.01 | 86.97 | 69.35 | 87.24 | 89.60 | 87.43 | 86.75 | 90.13 | 82.02 | 10.38 | 74.75% |
| KIVI | INT3 | 77.30 | 26.26 | 86.70 | 67.56 | 87.12 | 92.39 | 85.66 | 82.94 | 79.31 | 80.76 | 8.73 | 78.76% |
| VAR-Q | INT3 | 78.32 | 24.24 | 88.03 | 68.04 | 87.74 | 89.92 | 87.01 | 85.13 | 87.01 | 81.18 | 8.32 | 79.75% |
| Infinity-8B · Next-scale image / Text-to-image · batch 6 | |||||||||||||
| Baseline | BF16 | 95.41 | 62.12 | 90.43 | 83.54 | 88.27 | 89.30 | 91.57 | 92.83 | 88.61 | 85.72 | 67.43 | — |
| VAR-Q | INT8 | 96.43 | 62.88 | 89.89 | 84.00 | 90.57 | 92.57 | 89.23 | 87.12 | 92.68 | 85.97 | 33.88 | 49.75% |
| FlexGen | INT4 | 95.41 | 60.89 | 89.02 | 82.45 | 90.75 | 92.33 | 89.15 | 85.04 | 84.49 | 84.58 | 17.38 | 74.22% |
| KIVI | INT4 | 95.66 | 65.40 | 91.22 | 83.26 | 91.13 | 94.10 | 88.93 | 85.67 | 82.04 | 85.74 | 17.69 | 73.76% |
| VAR-Q | INT4 | 95.92 | 63.64 | 91.49 | 83.67 | 90.70 | 91.99 | 91.07 | 87.47 | 89.23 | 85.90 | 17.03 | 74.75% |
| KIVI | INT3 | 95.66 | 63.38 | 91.49 | 82.75 | 87.74 | 94.33 | 88.97 | 84.05 | 85.71 | 84.89 | 14.32 | 78.76% |
| VAR-Q | INT3 | 95.41 | 63.13 | 90.69 | 83.28 | 89.65 | 88.84 | 90.82 | 89.16 | 91.80 | 85.89 | 13.65 | 79.75% |
| VAR-Q | INT2 | 85.97 | 56.57 | 86.70 | 74.38 | 87.80 | 90.09 | 89.31 | 91.22 | 88.12 | 83.83 | 8.60 | 87.25% |
Bold and underline mark the best and second-best quality scores among quantized methods at the same precision, within each model. BF16 is the reference. ↑ Higher is better; ↓ lower is better. Memory reduction is relative to BF16 at the listed batch size.
The runtime hooks, packed low-bit kernels and curated configs are public. Please cite the paper if VAR-Q is useful in your research. Contact the authors ↗
git clone https://github.com/lujiaji/VAR-Q.git
cd VAR-Q && git checkout varq_official
pip install -e .Checkpoints are loaded by each upstream repository; VAR-Q never forks their source.
@inproceedings{xu2026varq,
  title = {VAR-Q: Tuning-free KV Cache Quantization
           for Visual Autoregressive Image and Video Generation},
  author = {Boxun Xu and Jiaji Lu and Yuxuan Yin and
            Zihu Wang and Ziyue Liu and Yu Wang and
            Zirui Liu and Peng Li},
  year = {2026},
  booktitle = {Advances in Neural Information Processing Systems},
  url = {https://boxunxu.top/assets/pdf/VAR-Q.pdf}
}